Social Disparities in Air Pollution
May 18, 2020

The air pollution in Salt Lake County, Utah, varies over the year, and at times it is the worst in the United States. The geography traps winter inversions and summertime smog throughout the Salt Lake Valley, but underserved neighborhoods—and their schools—experience the highest concentrations. Previous research has shown pollution disparities using annual averages of PM 2.5 levels, the tiny breathable particles that can damage lungs just hours after exposure. Children are especially at risk and experience more than just health effects; exposure to PM 2.5 affects school attendance and academic success.
A new study utilized a community-university partnership of nearly 200 PM 2.5 sensors through the University of Utah’s Air Quality and U (AQ&U) network. U researchers explored social disparities in air pollution in greater detail than ever before, and their findings reveal persistent social inequalities in Salt Lake County. The paper posted online ahead of publication in the journal Environmental Research. College of Engineering faculty from the School of Computing, chemical engineering, electrical and computer engineering and the Scientific Computing and Imaging Institute were involved in the study.
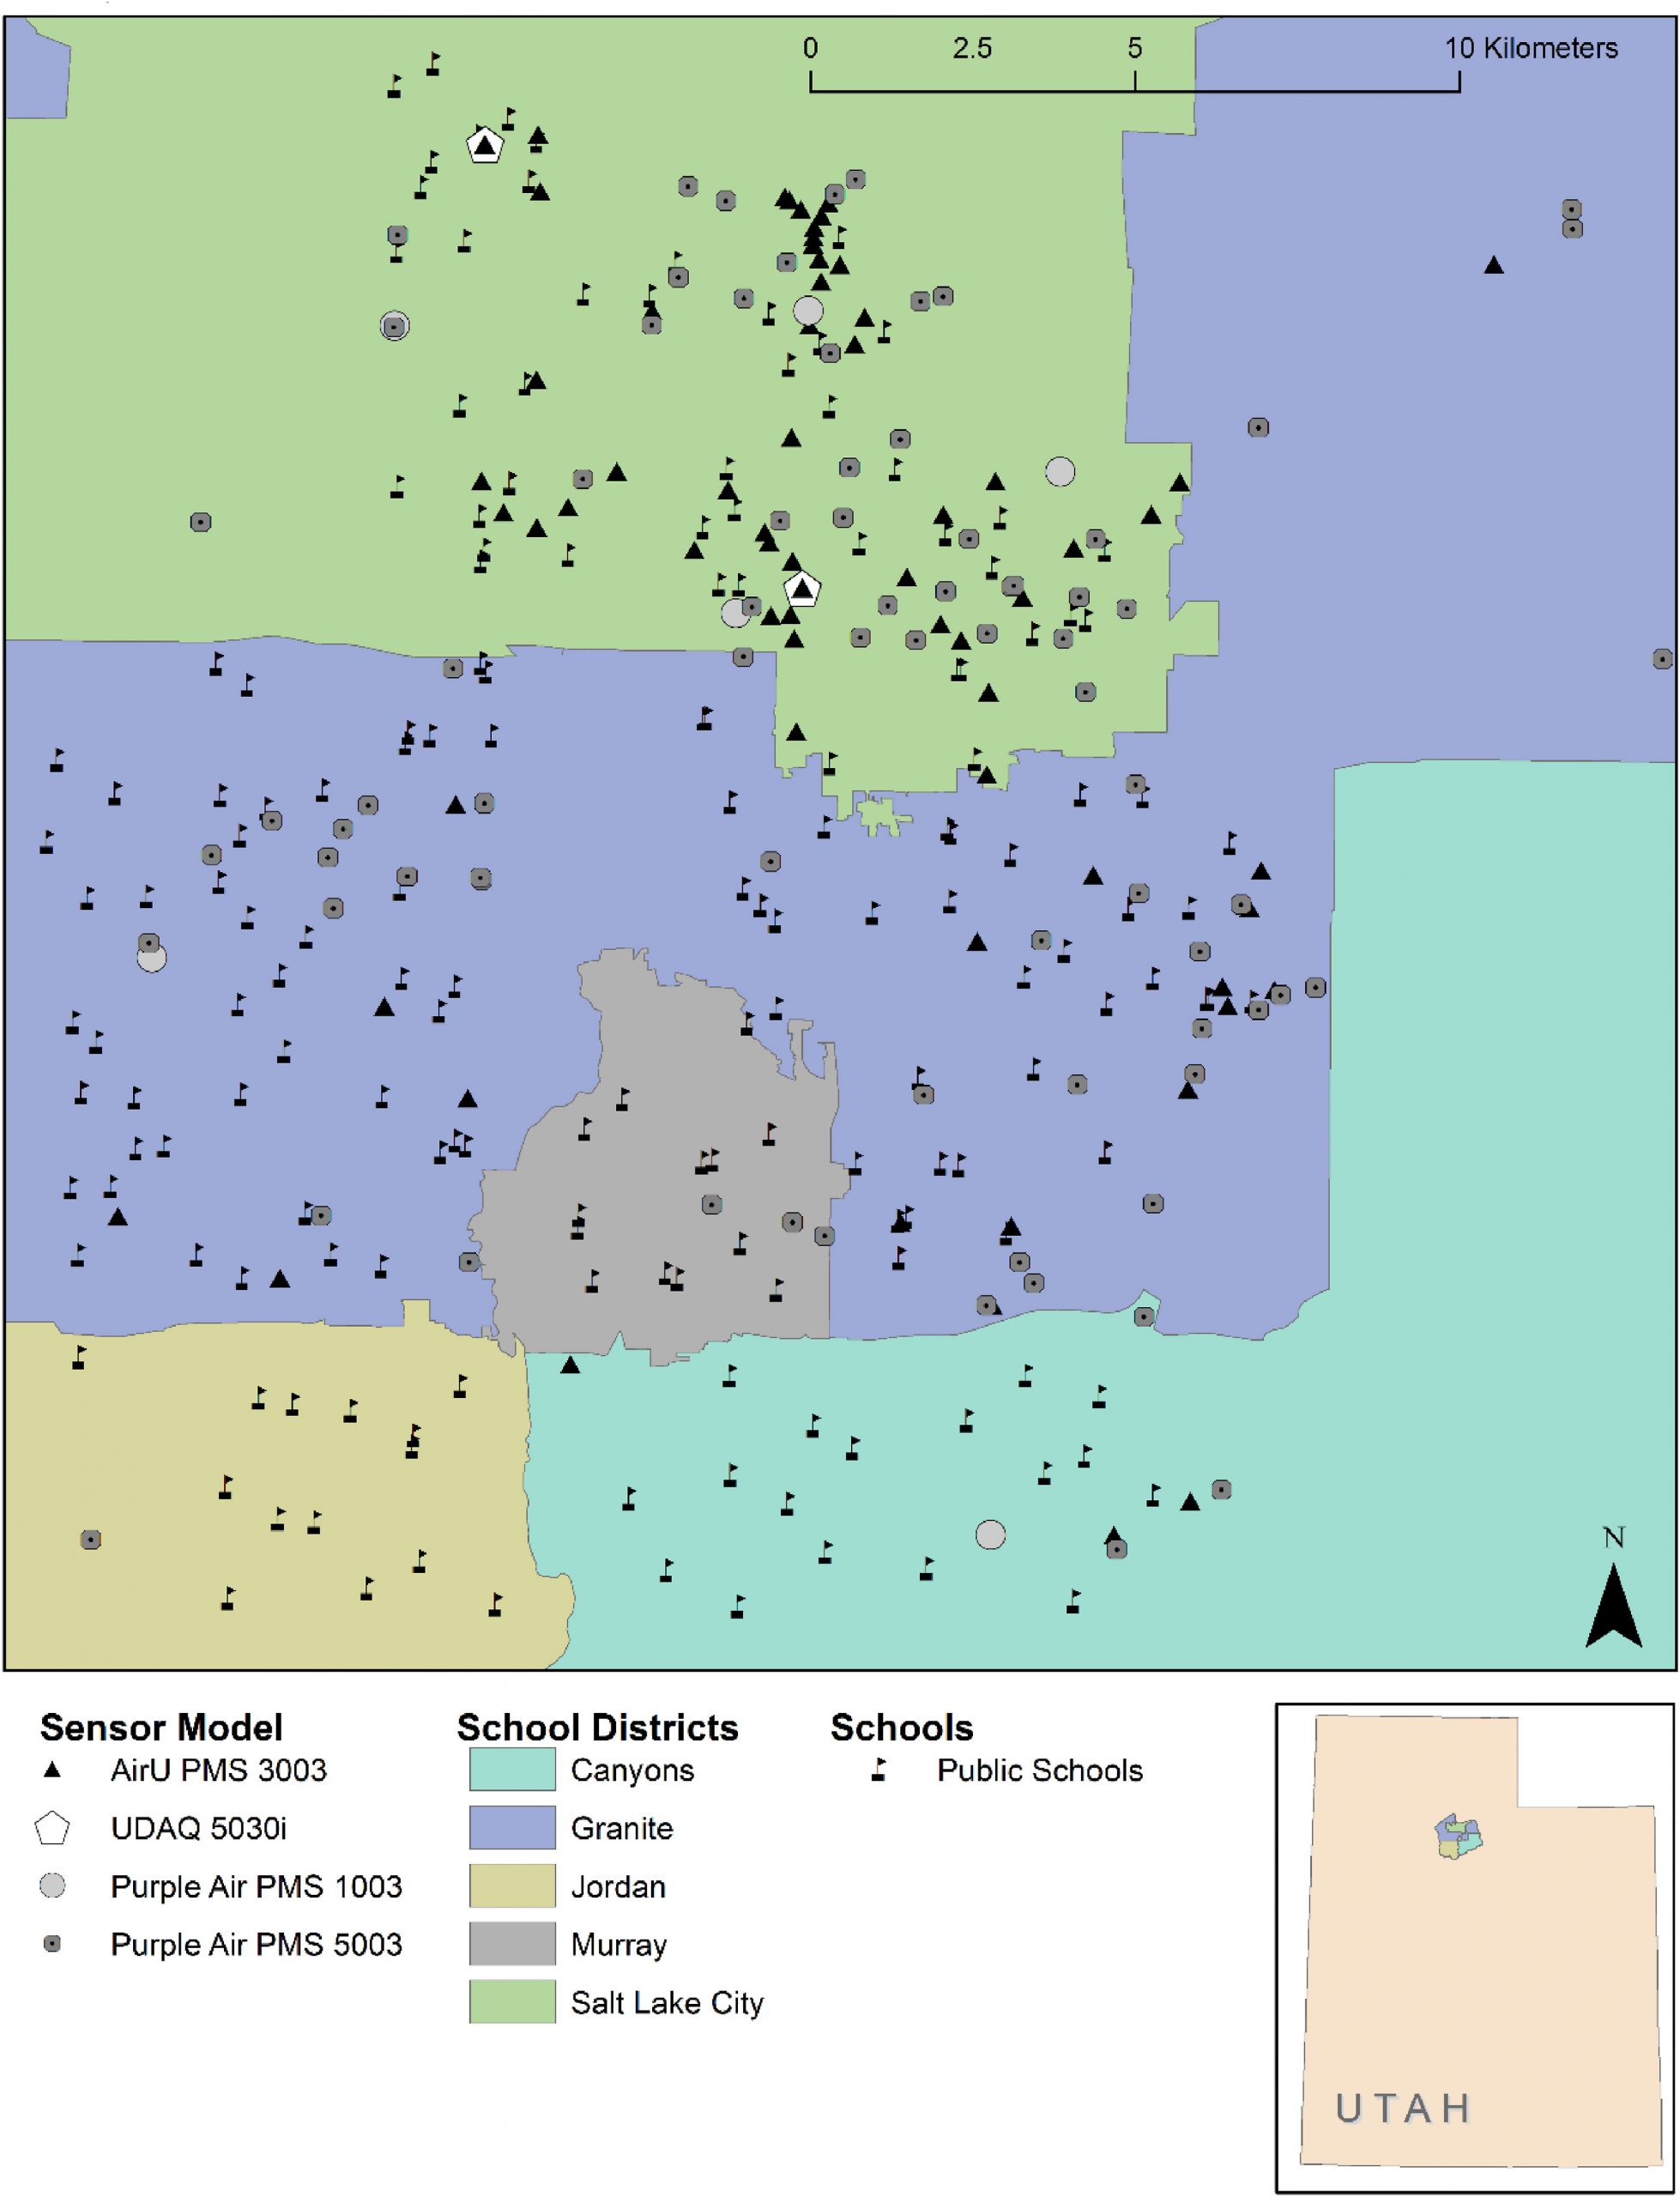
The researchers analyzed PM 2.5 levels at 174 public schools in Salt Lake County under three different scenarios: relatively clean, moderate inversion and major inversion days. Schools with predominately minority students were disproportionally exposed to worse air quality under all scenarios. Charter schools and schools serving students from low-income households were disproportionally exposed when PM 2.5 was relatively good or moderate. The findings speak to the need for policies that protect school-aged children from environmental harm.
“The persistence of these injustices—from the pretty clean, but health-harming levels all the way up to the horrific air days—at schools serving racial/ethnic minority kids is unacceptable,” said Sara Grineski, U professor of sociology and environmental studies and senior author of the paper.
The authors expected social disparities on bad air days but were surprised that they persisted on clean air days when PM 2.5 levels are still higher than recommended by the U.S. Environmental Protection Agency.
“What makes this project so novel is the community-U partnership that gave us access to this larger network of sensors and helped provide a detailed study. If we had relied on the Utah Department of Air Quality, we’d only have had two monitors and would have missed the nuanced variability,” said Casey Mullen, a doctoral student at the U and lead author of the study.
A higher-resolution snapshot
The worst PM2.5 episodes occur during the winter when cold air settles into the Salt Lake Valley and high-pressure weather systems act as a lid that seals in particulate matter from vehicle exhaust, wood-burning fires and emission from industrial facilities. Locals refer to these periods as inversions, which can last from a few days to a few weeks. The lowest elevations experience high concentrations of PM 2.5 for the longest time, impacting the residential communities disproportionately. The study compared the PM 2.5 levels at 174 public schools in 10-minute increments over two-day periods during each of three events: a major winter inversion (poor air quality), a moderate winter inversion (moderate air quality) and a relatively clean, fall day (good air quality). The extensive AQ&U network made up of 190 PM 2.5 sensors is extremely sensitive—each sensor collects PM 2.5 concentrations every second, then uploads the 60-second to a database that the public can access through the U’s AQ&U website.
The researchers broke down 174 Salt Lake County public schools with respect to race/ethnicity, economic status and student age. They also distinguished among school types: Title I Status (schools serving majority low-income households), charter school and alternative or special education school. The average student body was 31% Hispanic, 15% non-Hispanic minority and 54% white and about 45% of the schools were Title I eligible. Just over half of the schools were primary schools, about 16% were charter schools and about 5% were alternative or special education schools.
During relatively clean air days, racial/ethnic minority students were disproportionally exposed to high concentrations. At the school level, a 21% increase in the proportion of Hispanic students was associated with a 12% increase in concentration of PM 2.5. Charter schools were exposed to 20% higher concentrations of PM 2.5 than non-charter schools. During a moderate air quality day, charter, Title I schools and schools with greater proportions of minority students were exposed to higher concentrations of PM 2.5. During bad air quality days, exposure concentrations were higher for schools with larger proportions of minority students.
“No one has yet looked at school type in terms of environmental justice. Charter schools are a new variable that intrigued us,” said Mullen. “It’s starting to build on some other story that—why did we find these inequities in charter and Title I schools?”

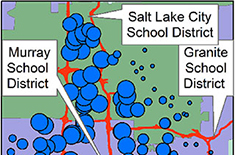
Mean 10-min PM2.5 levels for each 48-hour scenario at the Salt Lake County schools during a clean, moderate winter persistent air pool (PCAP, inversion) and major PCAP event. The bigger the blue dot, the higher the concentration of PM2.5 particles. In all three scenarios, the lowest PM2.5 concentrations were on the south and east side of the study area along the bench where elevation ascends from the valley floor.
Looking forward
This paper is one of many collaborations using the newly established AQ&U network.
“This is the first publication from such a diverse cross-disciplinary partnership arising from AQ&U, although we anticipate this is the first of many,” said Kerry Kelly, assistant professor in the Department of Chemical Engineering and co-author of the study. “We are enthusiastic about ongoing partnerships—to understand the effect of pollution microclimates on asthma exacerbations; to predict the severity of wildfire smoke plumes; and to engage student researchers and community partners in understanding the effect of sound walls on air quality.”
The air quality sensors and the network were built by Kelly; Wei Xing of the U’s School of Computing; Ross Whitaker and Miriah Meyer of the U’s School of Computing and the Scientific Computing and Imaging Institute (SCI); Tofigh Sayahi of the U’s Department of Chemical Engineering; Tom Becnel and Pierre-Emmanuel Gaillardon of the U’s Department of Electrical and Computer Engineering; and Pascal Goffin of SCI, all of whom also co-authored the study.
In future studies, the researchers hope to fill in even more gaps in the sensors to get a better picture of the social inequalities in Salt Lake County and in other areas, especially with regards to school-aged children.
“I see research like this continuing to build a wall of evidence that we have to do better in the way in which we regulate pollution exposure in the U.S. and worldwide,” said Grineski. “Evidence on top of evidence points to us having to do a better job of protecting people, especially kids, from pollution.”
Timothy Collins of the U’s Department of Geography also co-authored the study.

